
Key Insights
Population growth is not just increasing, it is concentrating in a smaller number of high momentum markets.
Identifying these markets early is where the real advantage lies. StrandScore™️ is built to do exactly that. Its scoring model and bubble detection framework analyze migration patterns, economic signals, and market dynamics to surface emerging opportunities before they become widely recognized.
Population Growth and Migration Trends
Not all growth is equal. It is becoming increasingly concentrated in a small number of markets, reshaping where real estate opportunity exists across the United States.
Metro areas continue to drive U.S. population growth.
According to the U.S. Census Bureau Vintage 2024 Population Estimates, the population across the nation’s 387 metropolitan areas increased by nearly 3.2 million people, or 1.1 percent, between July 2023 and July 2024. That slightly outpaced overall U.S. growth of 1.0 percent. Today, roughly 86 percent of Americans live in a metro area.
Even more telling, 88 percent of U.S. metros gained population during that period, up from just 64 percent during the height of the pandemic. Population declines seen in 2020 and 2021 have largely reversed.
This rebound has been driven by rising natural increase and stronger net international migration, along with easing domestic outflows from major cities. Growth has not disappeared. It has become more concentrated.
![Annual Population Growth Rates, U.S. vs. Metropolitan Areas, 2020 to 2024 – Source: U.S. Census Bureau]](https://strandcapitalholdings.com/wp-content/uploads/2026/03/Screenshot-2026-03-10-at-14.39.04.png)
Where Growth Is Concentrating
Some of the nation’s largest metro areas are now rebounding.
New York–Newark–Jersey City added more than 213,000 residents between 2023 and 2024, making it the largest gaining metro in the country. Houston added over 198,000 residents and Dallas–Fort Worth added nearly 178,000. Los Angeles and Chicago, which experienced pandemic-era losses, have returned to positive growth.
At the same time, the broader geographic trend remains clear. The South and West continue to dominate population gains.
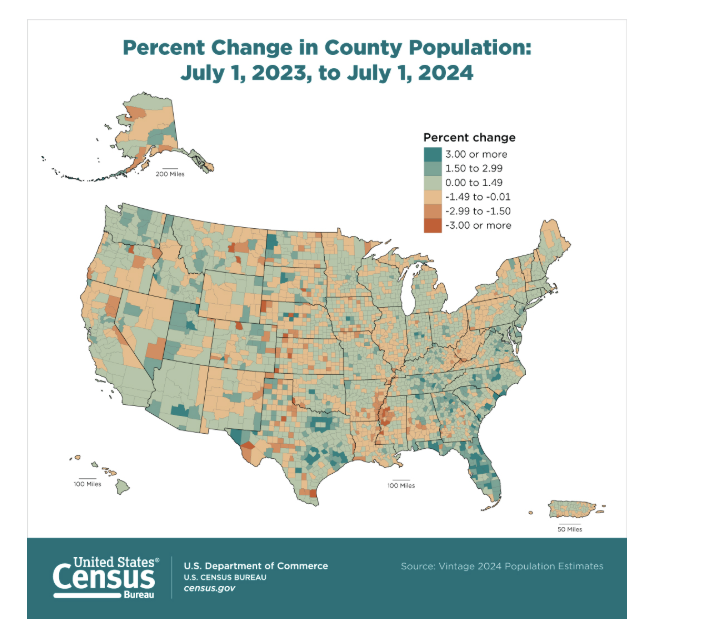
Texas metros such as Dallas–Fort Worth, Houston, and Austin posted some of the largest numeric increases in the country. Florida added more than 467,000 residents statewide between 2023 and 2024, with strong gains in Miami, Orlando, and several smaller metros. North Carolina and South Carolina also posted meaningful growth, including Raleigh and Charlotte.Phoenix and Riverside also ranked among the nation’s larger-gaining metros over the same period.
Growth is not evenly distributed. It is concentrating in a small number of high momentum markets.
Migration Patterns
Migration data reinforces the same pattern. According to the U.S. Census Bureau, while metro areas collectively experienced modest net domestic outmigration, 59 percent of individual metros recorded positive net domestic migration between 2023 and 2024. Smaller Sunbelt and coastal markets such as Ocala and Myrtle Beach saw growth driven largely by domestic movers. Recent increases in net international migration also played a significant role in boosting growth in major metros, particularly in New York, Houston, and Miami.
Job Growth and Economic Expansion
Labor market trends reinforce the same pattern. According to the U.S. Bureau of Labor Statistics, Dallas–Fort Worth recorded the largest net employment increase between November 2022 and November 2023, adding nearly 140,000 jobs. New York and Los Angeles followed, each adding over 100,000 jobs over the same period.
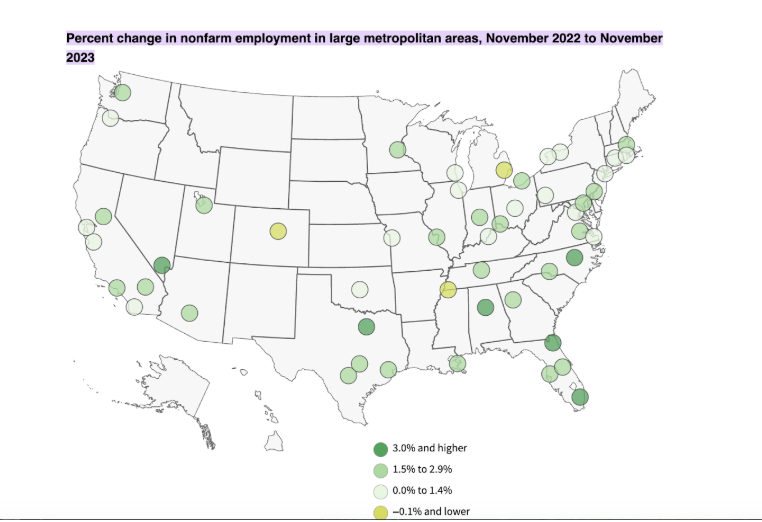
Across major metro areas, employment growth has been strongest in many of the same regions driving population gains, particularly across the South and West. Markets such as Texas and Florida continue to benefit from both job creation and inbound migration, reinforcing a cycle of sustained demand.
The Advantage in a Shifting Market
This is where a more data-driven approach becomes critical. Understanding not just where growth is happening, but where it is accelerating, allows investors to position ahead of the curve rather than react to it.
StrandScore™️ brings this into focus, combining data, predictive modeling, and investment expertise to identify high potential markets with stronger risk-adjusted return profiles.


